While development has dropped off in Cochrane since 2014, it's “a bit of misnomer ” to take those numbers at face value, according to Riley Welden, senior planner for the town, given the tremendous growth experienced in Cochrane since 2011.
While development has dropped off in Cochrane since 2014, it's “a bit of misnomer ” to take those numbers at face value, according to Riley Welden, senior planner for the town, given the tremendous growth experienced in Cochrane since 2011.
The 2011 census pins Cochrane's population at 17,580. Fast forward to the 2016 census data which has a population recorded at 25,122.
Welden added that the estimated 2016 population as of July 2016 puts the town's projected population at 26,894.
According to census data released this week by Statistics Canada, Cochrane is leading the pack compared to other Calgary-area rural communities at 47.1 per cent growth between 2011-2016; with Airdrie at 42.3 per cent; and Chestermere trailing at 34.2 per cent.
Calgary remains the fastest-growing Canadian city at 14.6 per cent. Alberta more than doubled the national average growth rates in this period, at 11.6 per cent (up from 10.8 per cent from 2006-2011).
This may come as a surprise to many, with considerations that according to Stats Canada in November 2016, Calgary's unemployment rate hit 10.2 per cent - leading the country in jobless numbers for four consecutive months.
Comparatively, while some eastern and central metropolitan areas have experienced slower growth in 2011-2016 when compared to 2006-2011 the only two census metro areas to show unchanged of declining growth rates are Thunder Bay, Ont. and Saint John, New Brunswick.
Development at a glance
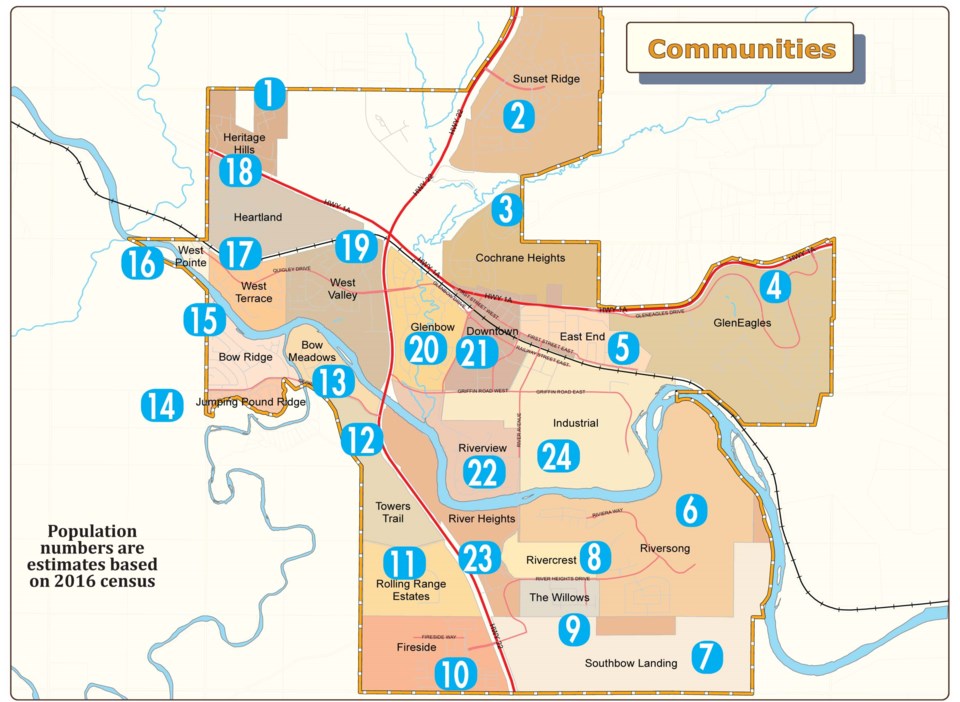
The populations listed below for each community are based on the 2016 municipal census.
Established communities are mostly or completely developed. Town planning department was able to provide approximate percentages of subdivisions approved (not including registered subdivisions or subsequent development) to provide readers a rough estimation of how much development has taken place in each developing community.
These are only estimations and not exact figures.
1) Heritage Hills: 1225
2) Sunset Ridge: 4454. Stage 1 = complete; Stage 2 = in progress; Stage 3 = not yet approved. Total subdivisions approved est. 70 per cent.
3) Cochrane Heights: 494
4) GlenEagles: 1669 (GlenEagles Estates: 209; GlenEagles Summit: 165; GlenEagles Villas: 200; GlenEagles Vistas: 94)
5) East End (Cochrane Settlement): 1397
6) Riversong: 2410. Final stage of Neighbourhood Plan in progress; total subdivision approval est. 75 per cent.
7) Southbow Landing: Undeveloped: Neighbourhood Plan approved, land-use pending; according to the ASP, the total community build-out could range between 7300-9000 people.
8) Rivercrest: Undeveloped: Neighbourhood Plan not approved; according to the draft Neighourhood Plan, the total number of units averaged at 582 (single and multi-unit dwellings).
9) The Willows: 292. Full subdivision approval.
10) Fireside: 1285. Nine phases approved to-date; est. 60 per cent of total subdivisions approved.
11) Rolling Range Estates: 67
12) Towers Trail: 123
13) Bow Meadows: 618
14) Jumping Pound Ridge: 614 (Crawford Ranch: 174)
15) Bow Ridge: 1281
16) West Pointe Estates: 285
17) West Terrace: 1,312
18) Heartland: 927. Six phases approved so far (around 50 per cent subdivisions approved to-date).
19) West Valley: 1,903
20) Glenbow: 2,050
21) Downtown: 279
22) Riverview: 1,026
23) River Heights: 105
24) Industrial Park: Population 21. According to 2017 assessment values, the residential/non-residential split is 89.27/10/73; if including the Community Revitalization Levy, this split is 87.42/12.8.
